
|
|
|
|
Mattias
Falck
|
|
Mattias
Karlsson
|
|

|
|
|
| |
Information |
|
|
|
|
|
|
|
| |
Filter |
|
|
|
|
|
|
|
|
| |
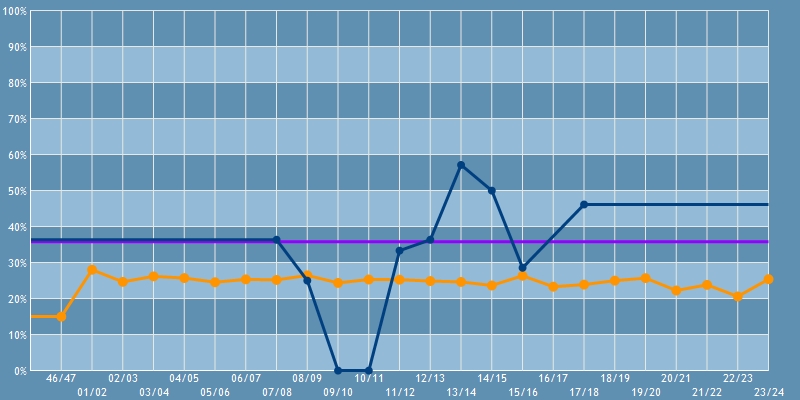
Graph - 5-Set Match. Won After Trailing 0-1 |
|
|
|
|
|
Percent per season for player
|
|
|
Average percent for player
|
|
|
Average per season for all players
|
|
|
|
|
| |
5-Set Match. Won After Trailing 0-1 |
|
|
| Total | | 29 out of 81 | 35.80% | | 24.62% | +11.18% |
| 2017/2018 | | | 6 out of 13 | 46.15% | | 35.80% | +10.35% | | 23.89% | +22.26% |
| |  | Elite Division | | 6 out of 13 | 46.15% | | 35.80% | +10.35% | | 26.11% | +20.04% |
| | | | Play-Off | 3 out of 6 | 50.00% | | 35.80% | +14.20% | | 37.74% | +12.26% |
| | | | Regular Season | 3 out of 7 | 42.86% | | 35.80% | +7.06% | | 24.10% | +18.75% |
| 2015/2016 | | | 2 out of 7 | 28.57% | | 35.80% | -7.23% | | 26.36% | +2.22% |
| | | Elite Division | | 2 out of 7 | 28.57% | | 35.80% | -7.23% | | 27.48% | +1.09% |
| | | | Play-Off | 1 out of 5 | 20.00% | | 35.80% | -15.80% | | 28.33% | -8.33% |
| | | | Regular Season | 1 out of 2 | 50.00% | | 35.80% | +14.20% | | 27.30% | +22.70% |
| 2014/2015 | | | 3 out of 6 | 50.00% | | 35.80% | +14.20% | | 23.66% | +26.34% |
| | | Elite Division | | 3 out of 6 | 50.00% | | 35.80% | +14.20% | | 21.25% | +28.75% |
| | | | Play-Off | 0 out of 2 | 0.00% | | 35.80% | -35.80% | | 34.62% | -34.62% |
| | | | Regular Season | 3 out of 4 | 75.00% | | 35.80% | +39.20% | | 19.74% | +55.26% |
| 2013/2014 | | | 4 out of 7 | 57.14% | | 35.80% | +21.34% | | 24.64% | +32.51% |
| | | Elite Division | | 4 out of 7 | 57.14% | | 35.80% | +21.34% | | 25.06% | +32.08% |
| | | | Play-Off | 0 out of 3 | 0.00% | | 35.80% | -35.80% | | 15.22% | -15.22% |
| | | | Regular Season | 4 out of 4 | 100.00% | | 35.80% | +64.20% | | 26.38% | +73.62% |
| 2012/2013 | | | 4 out of 11 | 36.36% | | 35.80% | +0.56% | | 24.88% | +11.48% |
| | | Elite Division | | 4 out of 11 | 36.36% | | 35.80% | +0.56% | | 26.26% | +10.10% |
| | | | Play-Off | 0 out of 2 | 0.00% | | 35.80% | -35.80% | | 26.53% | -26.53% |
| | | | Regular Season | 4 out of 9 | 44.44% | | 35.80% | +8.64% | | 26.22% | +18.22% |
| 2011/2012 | | | 3 out of 9 | 33.33% | | 35.80% | -2.47% | | 25.27% | +8.06% |
| | | Elite Division | | 3 out of 9 | 33.33% | | 35.80% | -2.47% | | 24.51% | +8.82% |
| | | | Play-Off | 0 out of 2 | 0.00% | | 35.80% | -35.80% | | 12.50% | -12.50% |
| | | | Regular Season | 3 out of 7 | 42.86% | | 35.80% | +7.06% | | 26.11% | +16.75% |
| 2010/2011 | | | 0 out of 2 | 0.00% | | 35.80% | -35.80% | | 25.32% | -25.32% |
| | | Elite Division | | 0 out of 2 | 0.00% | | 35.80% | -35.80% | | 25.00% | -25.00% |
| | | | Play-Off | 0 out of 2 | 0.00% | | 35.80% | -35.80% | | 25.00% | -25.00% |
| 2009/2010 | | | 0 out of 3 | 0.00% | | 35.80% | -35.80% | | 24.37% | -24.37% |
| | | Elite Division | | 0 out of 3 | 0.00% | | 35.80% | -35.80% | | 29.41% | -29.41% |
| | | | Play-Off | 0 out of 3 | 0.00% | | 35.80% | -35.80% | | 29.41% | -29.41% |
| 2008/2009 | | | 3 out of 12 | 25.00% | | 35.80% | -10.80% | | 26.47% | -1.47% |
| | | First Division | | 3 out of 12 | 25.00% | | 35.80% | -10.80% | | 28.37% | -3.37% |
| | | | Regular Season | 3 out of 12 | 25.00% | | 35.80% | -10.80% | | 28.37% | -3.37% |
| 2007/2008 | | | 4 out of 11 | 36.36% | | 35.80% | +0.56% | | 25.20% | +11.16% |
| | | Elite Division | | 4 out of 11 | 36.36% | | 35.80% | +0.56% | | 26.82% | +9.54% |
| | | | Regular Season | 4 out of 11 | 36.36% | | 35.80% | +0.56% | | 26.82% | +9.55% |
|
|
|
|